
SciChart 是否支持中文
SciChart 是否支持中文
SciChart WPF 完全支持中文字符显示,因为它基于 Unicode 字符编码系统构建。作为一个现代的 图表库,SciChart 能够正确渲染和显示各种语言的字符,包括中文简体、繁体以及其他 Unicode 字符集。
Unicode 支持原理
SciChart WPF 利用 .NET 平台原生的 Unicode 支持来处理多语言文本渲染。由于该平台遵循 Unicode 标准,SciChart 能够无缝显示中文字符,无需额外配置或插件。唯一的要求是操作系统中安装了支持中文字符渲染的合适字体。
2D 图表中的中文字符实现
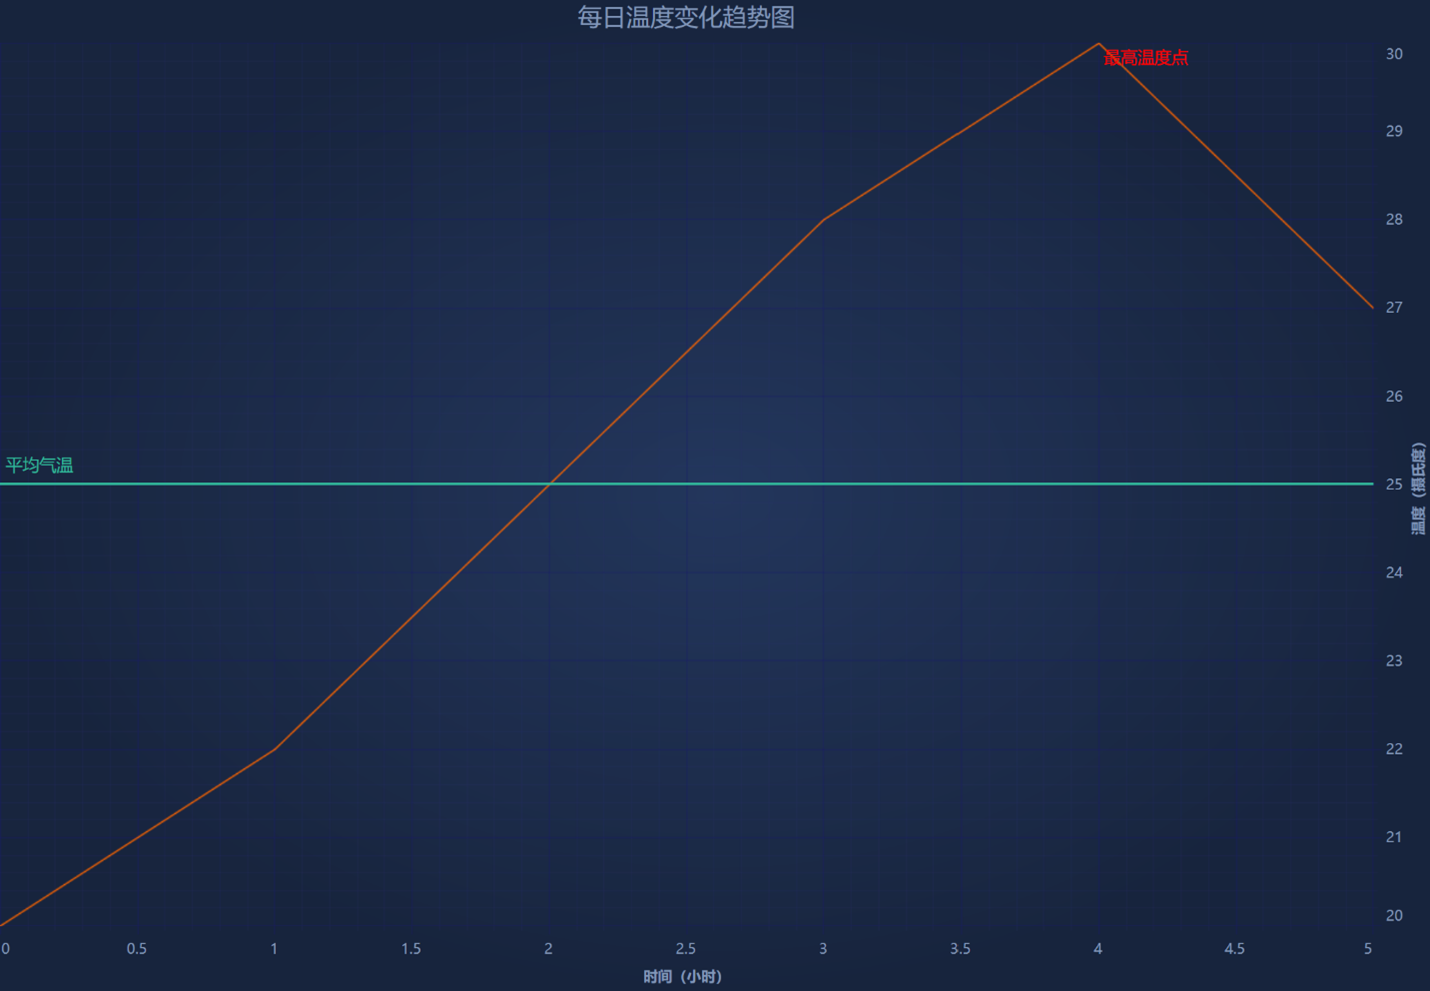
以下代码示例展示了如何在 SciChart 2D 图表中使用中文标签和文本:
| 如何在 SciChart 2D 图表中使用中文标题和文本 |
Copy Code |
|---|---|
// 创建 SciChart 表面 var sciChartSurface = new SciChartSurface { FontFamily = new FontFamily("Microsoft YaHei"), ChartTitle = "每日温度变化趋势图" }; // 配置带中文标签的 X 轴 var xAxis = new NumericAxis { FontFamily = new FontFamily("Microsoft YaHei"), AxisTitle = "时间(小时)" }; // 配置带中文标签的 Y 轴 var yAxis = new NumericAxis { FontFamily = new FontFamily("Microsoft YaHei"), AxisTitle = "温度(摄氏度)" }; // 添加轴到图表 sciChartSurface.XAxis = xAxis; sciChartSurface.YAxis = yAxis; // 创建数据系列 var dataSeries = new XyDataSeries<double>(); // 添加数据点 dataSeries.Append(new[] { 0d, 1, 2, 3, 4, 5 }, new[] { 20d, 22, 25, 28, 30, 27 }); // 创建线系列 var lineSeries = new FastLineRenderableSeries { DataSeries = dataSeries, Stroke = Color.FromRgb(255, 102, 0) }; // 添加系列到图表 sciChartSurface.RenderableSeries.Add(lineSeries); | |
文本注释和标签
SciChart 还支持在图表上添加中文文本注释:
| 为图表添加中文文本注释 |
Copy Code |
|---|---|
// 创建中文文本注释 var textAnnotation = new TextAnnotation { X1 = 4, Y1 = 30, Text = "最高温度点", FontSize = 14, FontFamily = new FontFamily("Microsoft YaHei"), Foreground = new SolidColorBrush(Color.FromRgb(255, 0, 0)) }; // 添加注释到图表 sciChartSurface.Annotations.Add(textAnnotation); // 创建中文行注释 var lineAnnotation = new HorizontalLineAnnotation { Y1 = 25, ShowLabel = true, LabelValue = "平均气温", LabelPlacement = LabelPlacement.TopLeft, FontSize = 14, FontFamily = new FontFamily("Microsoft YaHei"), StrokeThickness = 2, Stroke = new SolidColorBrush(Color.FromRgb(50, 185, 155)) }; // 添加注释到图表 sciChartSurface.Annotations.Add(lineAnnotation); | |
3D 图表中的中文字符实现
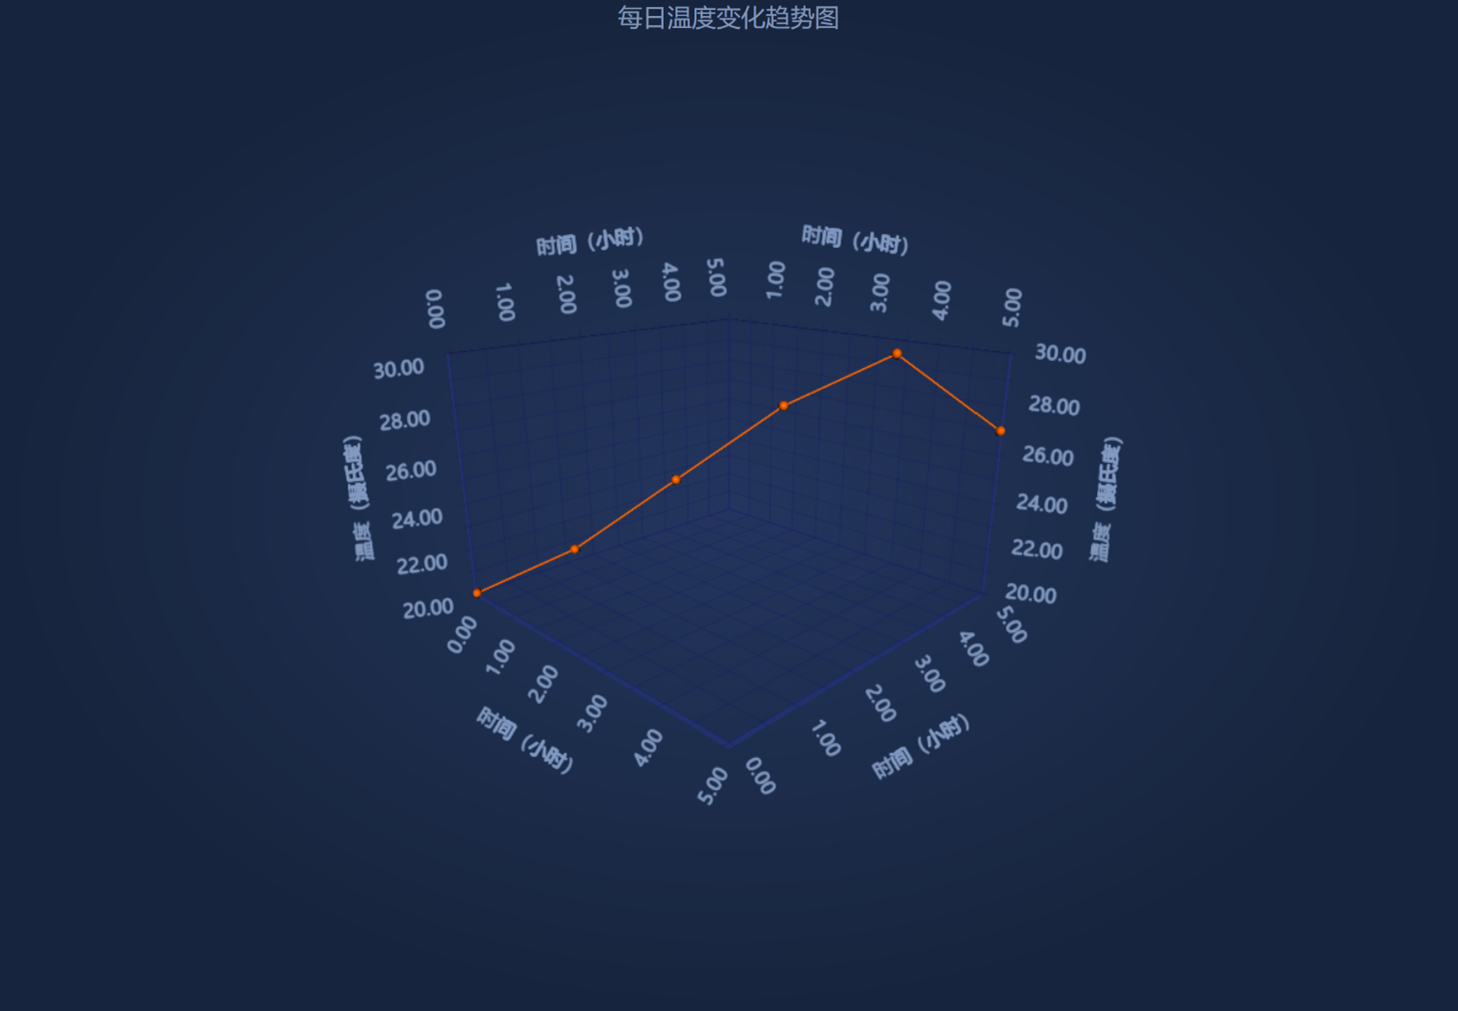
以下代码示例展示了如何在 SciChart 3D 图表中使用中文标签和文本:
| SciChart 3D 图表中的中文标签和文本 |
Copy Code |
|---|---|
// 创建 SciChart 表面 var sciChart3DSurface = new SciChart3DSurface { FontFamily = new FontFamily("Microsoft YaHei"), ChartTitle = "每日温度变化趋势图", IsXyzGizmoVisible = false }; // 配置带中文标签的 X 轴 var xAxis = new NumericAxis3D { FontFamily = new FontFamily("Microsoft YaHei"), AxisTitle = "时间(小时)" }; // 配置带中文标签的 Y 轴 var yAxis = new NumericAxis3D { FontFamily = new FontFamily("Microsoft YaHei"), AxisTitle = "温度(摄氏度)" }; // 配置带中文标签的 Z 轴 var zAxis = new NumericAxis3D { FontFamily = new FontFamily("Microsoft YaHei"), AxisTitle = "时间(小时)" }; // 添加轴到图表 sciChart3DSurface.XAxis = xAxis; sciChart3DSurface.YAxis = yAxis; sciChart3DSurface.ZAxis = zAxis; // 创建数据系列 var dataSeries = new XyzDataSeries3D<double>(); // 添加数据点 dataSeries.Append(new[] { 0d, 1, 2, 3, 4, 5 }, new[] { 20d, 22, 25, 28, 30, 27 }, new[] { 0d, 1, 2, 3, 4, 5 }); // 创建线系列 var pointLineSeries = new PointLineRenderableSeries3D { DataSeries = dataSeries, Stroke = Color.FromRgb(255, 102, 0), PointMarker = new SpherePointMarker3D { Size = 8 } }; // 添加系列到图表 sciChart3DSurface.RenderableSeries.Add(pointLineSeries); | |
最佳实践建议
- 字体选择:使用系统默认的中文字体,如 Microsoft YaHei(微软雅黑)
- 编码:确保您的应用程序使用 UTF-8 编码
- 字体大小:根据图表大小调整合适的字体大小,确保中文字符清晰可读
通过以上配置和代码示例,您可以在 SciChart WPF 应用程序中完美地显示和使用中文字符,创建本地化的图表界面。